Producers Blog
WeatherTrends360: Putting Some Certainty in the Uncertain
Challenges get thrown at growers every single year. The one challenge that affects those fields the most is the weather. Although it has that big of an impact, it can rarely be predicted with accuracy. That uncertainty will never completely go away, but it does become much less uncertain with WeatherTrends360® and Advantage Acre®.
WeatherTrends utilizes mathematical statistics rather than physics to predict the trend of weather 11 months in advance. To put it simply, imagine a farmer is sitting at a BlackJack table, and the dealer is Mother Nature. Currently as farmers, after the cards are dealt they cannot see either of the dealer’s cards before they make a decision on what to do next. With WeatherTrends, farmers can now see one of the dealer’s cards. This makes it so they can better predict the odds of what will happen in the future. Although this is not a guarantee of an outcome, it can bring some comfort to farmers and aid in the decision-making process.
This data set is complex and large, but Advantage Acre collects it all for each individual field, and makes it much easier to interpret. After a field is selected, simply click on the Weather tab at the top to pull the weather pane up on the left side of the screen. With a free account, a grower can see the Weather Overview and the four-week forecast. The Weather overview is a compilation of the past year’s weather, segmented out into different time ranges for precipitation, temperature, and Growing Degree Units. The four-week forecast is a summary by week for the upcoming month for those three categories, as well.
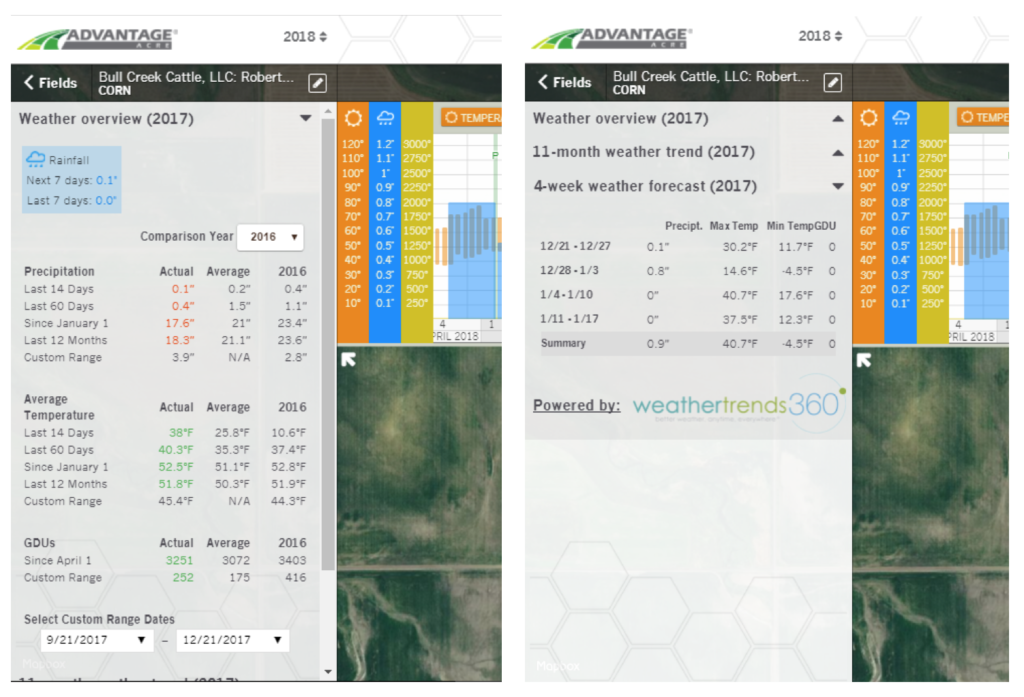
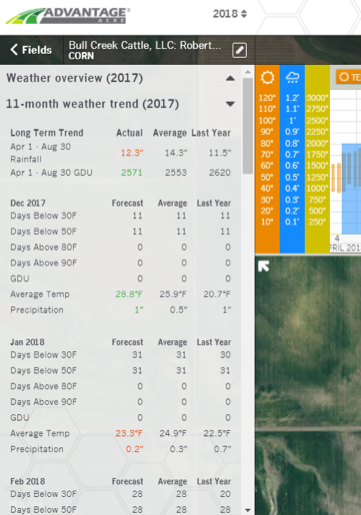
If the user has an Advantage Acre Plus account, they will then fully unlock the potential of WeatherTrends with 11-month forecasting. The long-term trend can be viewed in a couple different ways. The first is on the left side pane, where Advantage Acre sorts the data by month and gives the user a snapshot of what that month will be like. It takes the forecast and breaks it down by Days Below 30, Days Below 50, Days above 80, Days above 90, GDUs accumulated, Average Temp, and Precipitation. If the forecast number is colored green, then it will be higher than the average. If it is red, it is lower than the average, allowing the user to quickly look and see what that month will be like in comparison to the average. Last year’s actual weather is also there for comparison purposes, since that is the weather in most recent memory.
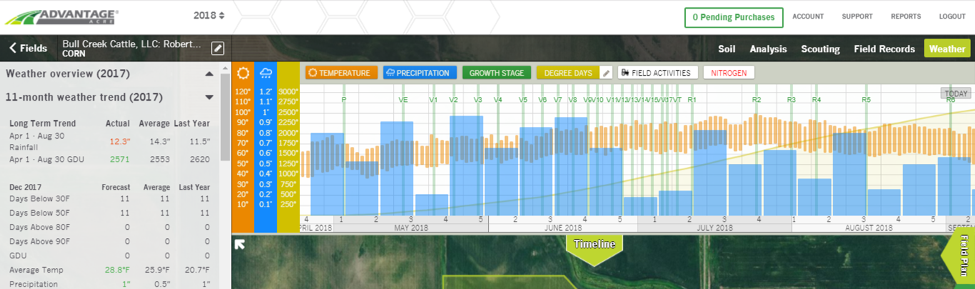
All of this data is also displayed within the Timeline at the top of the page. Temperature is displayed per individual day throughout the 11-months as well as in the past. Precipitation is displayed as daily as well, up until two weeks in the future, and from there it is displayed as a weekly total. This data is then complied to predict the GDUs accumulated since planting which also allows Advantage Acre to predict each growth stage through maturity. The user can then get an idea for what the weather will be like at critical stages of the crop’s life. In the future, we will discuss the Timeline further.
If you have any questions regarding Advantage Acre, please contact your local dealer or District Sales Manager.