Producers Blog
A South Dakota Population Study
Each year, our agronomists focus on a special project – here’s a look some of their findings in 2017.
As agronomists, we try to focus on a topic that will bring value to our region. My special project this year was to have a population study of six of our hybrids in our mid-maturity group planted at various populations across a field. The goal of this study was to help us better understand the hybrid population tolerances of our hybrids so we could have more accurate populations that filter into Advantage Acre®.
Field Details
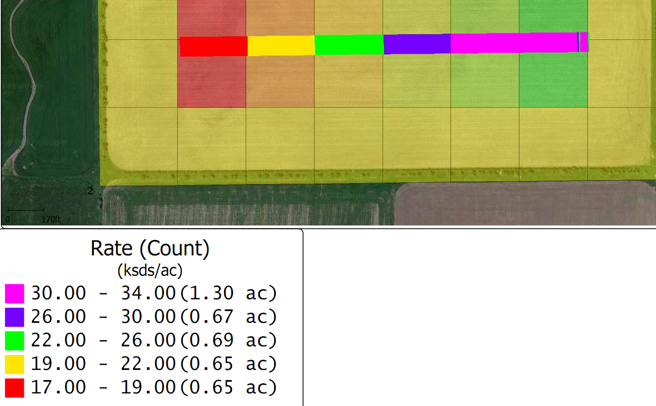
The image below shows the evenly spaced blocks across the field making it simple for us to turn on the prescription to plant a single pass with six different hybrids at six rows a piece planted from east to west. Each test block was about 0.7 acres, giving us a big testing area at each population. Starting from the east side:
- Planned populations – buffer at 25.5K, 36K, 32K, 28K, 24K, 20K and 16K
- What was planted – two blocks of 32K, then a block each of 28k, 24k, 20k, and the last block of 18k
The parameters set within the monitor did not allow us to hit the highest population and the lowest population. Even with that restriction, 32K is fairly high for the area and still gives us a good understanding of the hybrid capabilities at higher populations.
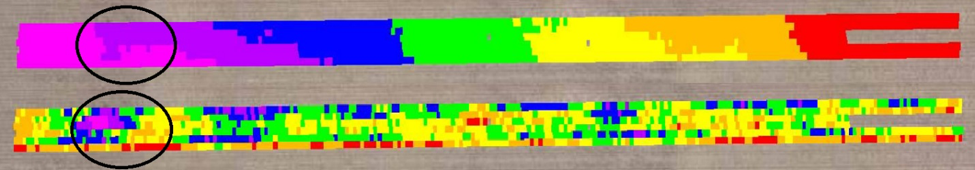
Shown below is the prescription on the bottom layer with the as-planted map overlaid. As you can see on the right side, there are two testing blocks at 32k and the final block at 18k.
Moisture Information
This year’s study was in an area where moisture was lacking through most of early spring through July, putting the crop under extreme stress. From April through August, rainfall reported was 10.51 inches – with most of it coming in late July through August. Average rainfall for the area is 13.43 inches during the same timeframe. The field was a nearly level Davis silt loam on no-tilled soybean stubble with minimal subsoil moisture. Planting populations in this area are typically between 25-27K and with normal rainfall usually optimizes yield.
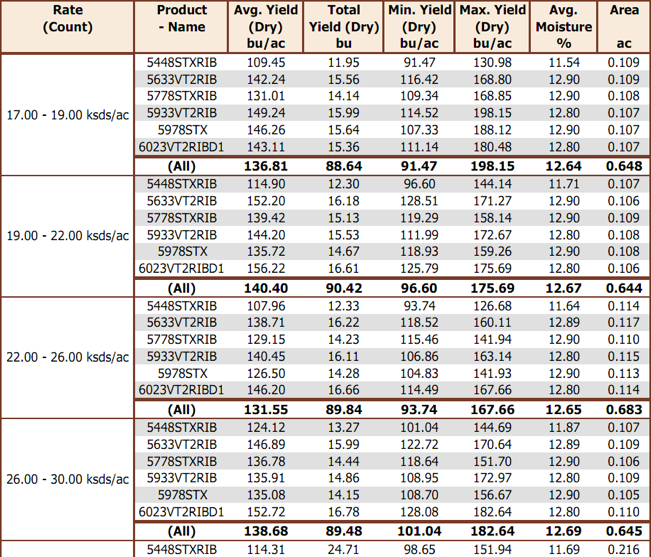
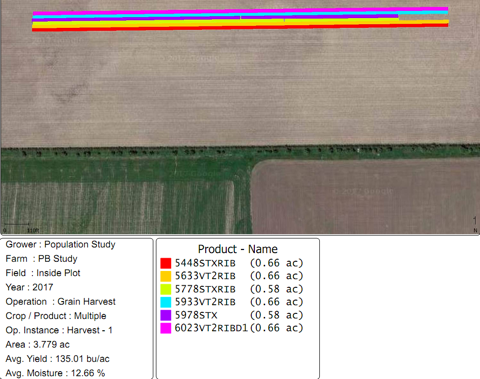
With this information, it is critical when looking at this data to understand that where water moved within the field had the greatest effect on yield. Below is an image showing that on the west side, where yields were the highest, was the area within the field where water would have had a chance to pool. It also happens to be where the lowest populations were, so we take this data for what it is: a dry year in low area at low populations being the best. If we could have replicated this plot type in multiple locations, we may have seen different results.
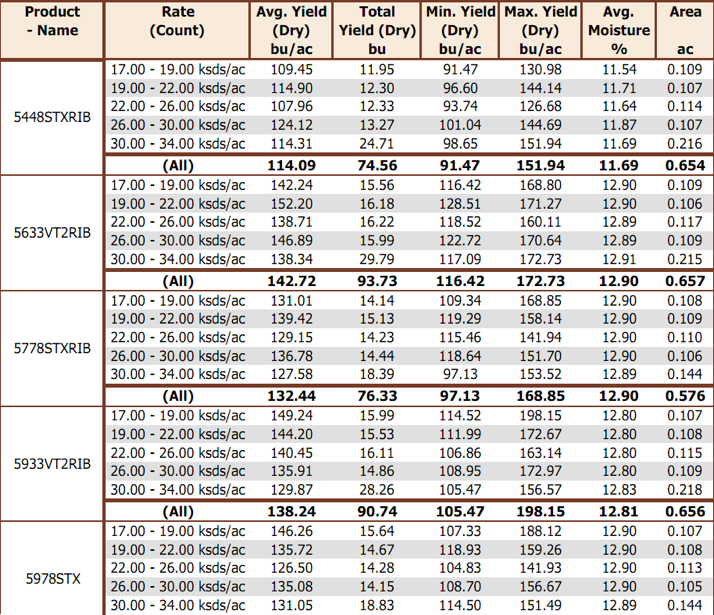
Hybrids Chosen & Yield Data
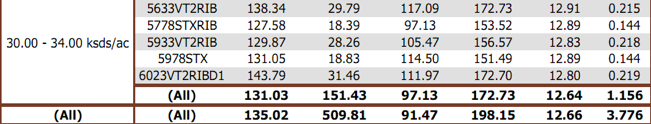
The hybrids we chose for the study were 5448STXRIB, 5633VT2RIB, 5778STXRIB, 5933VT2RIB, 5978STXRIB and 6023VT2RIBD1. Yield data is broken down in two ways: yield by product rate and yield by rate by product. Keep in mind, this is only one site. In the future, we’d like to do multiple sites with the same hybrids with the same setup to try to get replications.
Hybrids that we expect to do well in these conditions would have excellent drought tolerance with flex capability. 6023VT2RIBD1, being a DroughtGard®, performed very well and fit the criteria. 5933VT2RIB also did very well at the lower populations where there was a little more moisture vs. other areas at higher populations. Overall, 20K planting population was the highest-yielding block at 140.40 bu/ac. The second highest-yielding population block was 28K at 138.68 bu/ac.
Yield by Rate by Product
Yield by Product
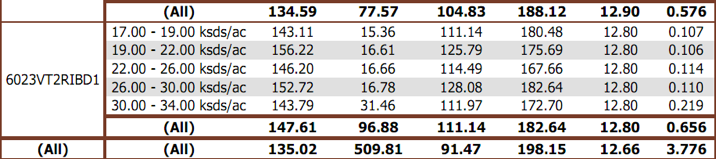
Hybrid Locations
Yield Data
Final Thoughts
Overall, these population studies give us an interesting data set that is easy to set up and could be replicated in multiple locations, which gives us a more accurate representation of how these hybrids act in different areas at different populations. If you’d like to be a part of trial like this, contact your local Producers Hybrids Sales Agronomist today.