Producers Blog
Emergence Timing Affects Yield – But By How Much?
Each year, our agronomists focus on a special project – here’s a look some of their findings in 2017.
We’ve all been out walking corn fields in September and have run across that one runt ear among many nice-looking ears. Many times, when we see this we say, “Must have emerged late,” and walk on. While these instances are usually the most extreme cases and are easy to see, are we losing yield even with some of the other “normal-looking” ears right next to it? To test that theory, this spring I did an emergence check with 6253VT2RIB on one of our customer’s fields and then harvested the ears this fall and hand shelled and weighed the grain. Here’s what I found:
Field Details
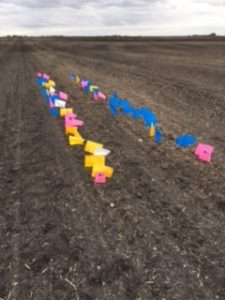
This field has been a corn/soybean rotation for four years now. The farmer does conventional tillage in the spring and fall. As you can see in the picture, the ground was worked nice and level and residue was not an issue.
This field was planted on May 12th, which was normal for this year for our area. This field is in our Advantage Acre® program, so I went back and looked at the weather for that day. The high temperature that day was 75 degrees, followed by 5 days of similar temperatures before turning drastically colder. I flagged my first-emerged corn 11 days later, on the morning of May 23rd. When I looked back in Advantage Acre at this field, it predicted emergence on May 24th, so it was very close.
Emergence in Observed Rows
Below is a chart showing how emergence was for the two rows I observed. The number shown is the number of plants counted in 23 ft 9 inches, or 1/1000th of an acre on 22 inch rows.
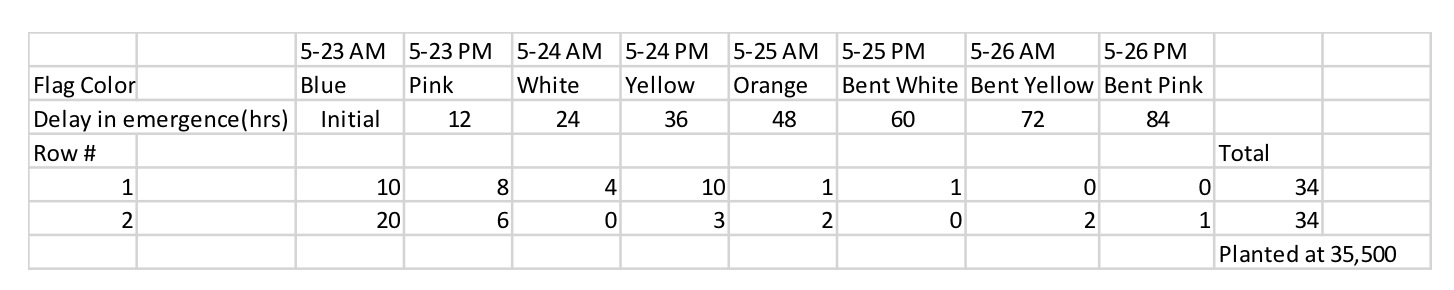
As you can see, the majority of the plants (94%) were emerged in this field in the first 48 hours, with the last few emerging in the following 36 hours. Below is a chart showing what I found with the four ears that emerged after the first 48 hours, along with a first-emerged ear of similar kernel rows and length:
|
Flag Color |
Hrs after emergence | Kernel Rows | Kernels Long | Weight Oz |
|
Bent White |
60 | 18 | 35 |
6.3 |
|
Bent Yellow |
72 | 14 | 37 |
6.2 |
|
Bent Yellow |
72 | 14 | 39 |
6.9 |
|
Bent Pink |
84 | 14 | 37 |
6.2 |
| Blue | First emerge | 14 | 37 |
6.5 |
As you can see in the chart above, the first-emerged ear had more weight than all but one of the latest-emerging ears. After looking at my emergence notes, that one ear that was heavier happened to be next to one of the two skips we had. With this plant having more room and less pressure, it would make sense that this ear was able to flex more and put on more ear weight.
Tenths of ounces don’t seem like much of a difference in weight, but in this situation, we had 34,000 harvestable ears per acre. If you take 0.1 oz and multiply that by 34,000 ears, you get 3,400 oz or 212.5 lbs per acre. Divide that out by the standard 56 lb/bu TW we use for corn and that equates to a 3.79 bu/a loss for every 0.1 oz less in ear weight.
Using the numbers above, if we throw out the one outlier ear that was next to a gap, we averaged 6.23 oz/ear for the delayed emerging plants compared to 6.5 for the first emerging plant. If we take that 0.27 oz difference and multiply it by the 4,000 plants that emerged after 48 hours, we get 1,080 oz, or 67.5 lbs, which equals a 1.2 bu/a loss. Now keep in mind, the ear size I used for the first emerging plant of 14*37 was lower than the average ear size for all the first emerged plants by about 3.5%. So, if we used the average ear size our yield loss would have been greater.
Ear Weights in Observed Rows
I also went and took ear weights for various sized ears that emerged first, 12, 24 and 36 hours later. I looked for ears in each timeframe that had the exact same number of kernel rows and kernels per row so that we had a fair comparison. Not every flag color had an ear size that matched up, but below are some comparisons that I was able to look at:
| Flag Color | Hrs after emergence | Kernel Rows | Kernels Long | Weight Oz |
| Blue | First emerge | 14 | 36 | 6.5 |
| Pink | 12 | 14 | 36 | 5.5 |
| White | 24 | 14 | 36 | 6.4 |
| Blue | First emerge | 16 | 40 | 7.5 |
| Pink | 12 | 16 | 40 | 7.4 |
| White | 24 | 16 | 41 | 6.2 |
| Yellow | 36 | 16 | 40 | 7.3 |
| Blue | First emerge | 14 | 41 | 7.3 |
| Pink | 12 | 14 | 41 | 7 |
| Yellow | 36 | 14 | 41 | 6.8 |
| Blue | First emerge | 14 | 34 | 5.6 |
| Pink | 12 | 14 | 34 | 4.9 |
| Yellow | 36 | 14 | 34 | 5.2 |
There was some variability among flag colors – as there always will be when doing a test like this – but there was one constant: In every ear size that I weighed, the blue flags (the very first emerged plants) always had the highest weight per ear when compared to similar ear sizes of later emerging plants. The only two colors I was able to match up in all four tests were blue and pink, or the first emerging plants and the ones that emerged 12 hours later. The ears for the blue flags averaged 6.72 oz/ear and the ears for the pink flags averaged 6.2 oz/ear.
If we look at the very first chart, we see that 14 plants were pink between the 2 rows. This would mean on average 14,000 plants/acre emerged in this time frame. If we take 14,000 and multiply it by the 0.52 oz/ear difference we saw on average, we get 7,280 ounces, or 455 lbs less grain per acre. Divide that out by the standard 56 lb/bu TW and we get 8.125 bu/a less yield on average between the blue flags (first emerged) and the pink flags (the plants that emerged 12 hrs later).
Final Thoughts
I know a lot has been talked about how late-emerging plants are behind from the start and never will catch up and, like I mentioned at the start, we have most likely seen the extreme cases of this with the one runt ear mixed in from time to time. In this project, the grower had what I think most of us – myself included – would consider good emergence with 94% of the plants being emerged in the first 48 hours. The fact that I did not see a difference in ear size but the weight per ear is being affected simply reiterates the importance of even emergence in the spring. With commodity prices where they are at, anything we can do to gain yield can make a big difference at the end of the year.
The good thing about this scenario? Making a nice, uniform seed bed and making sure that all the seed is at a consistent, uniform depth and spacing are things that don’t add any expense per acre. Additionally, as we saw above, the outcome of having uniform emergence can definitely add income per acre.
Questions? I’d be happy to share more about this study. Contact me at aaron.ahrenholz@producershybrids.com or reach out to the sales agronomist in your area.